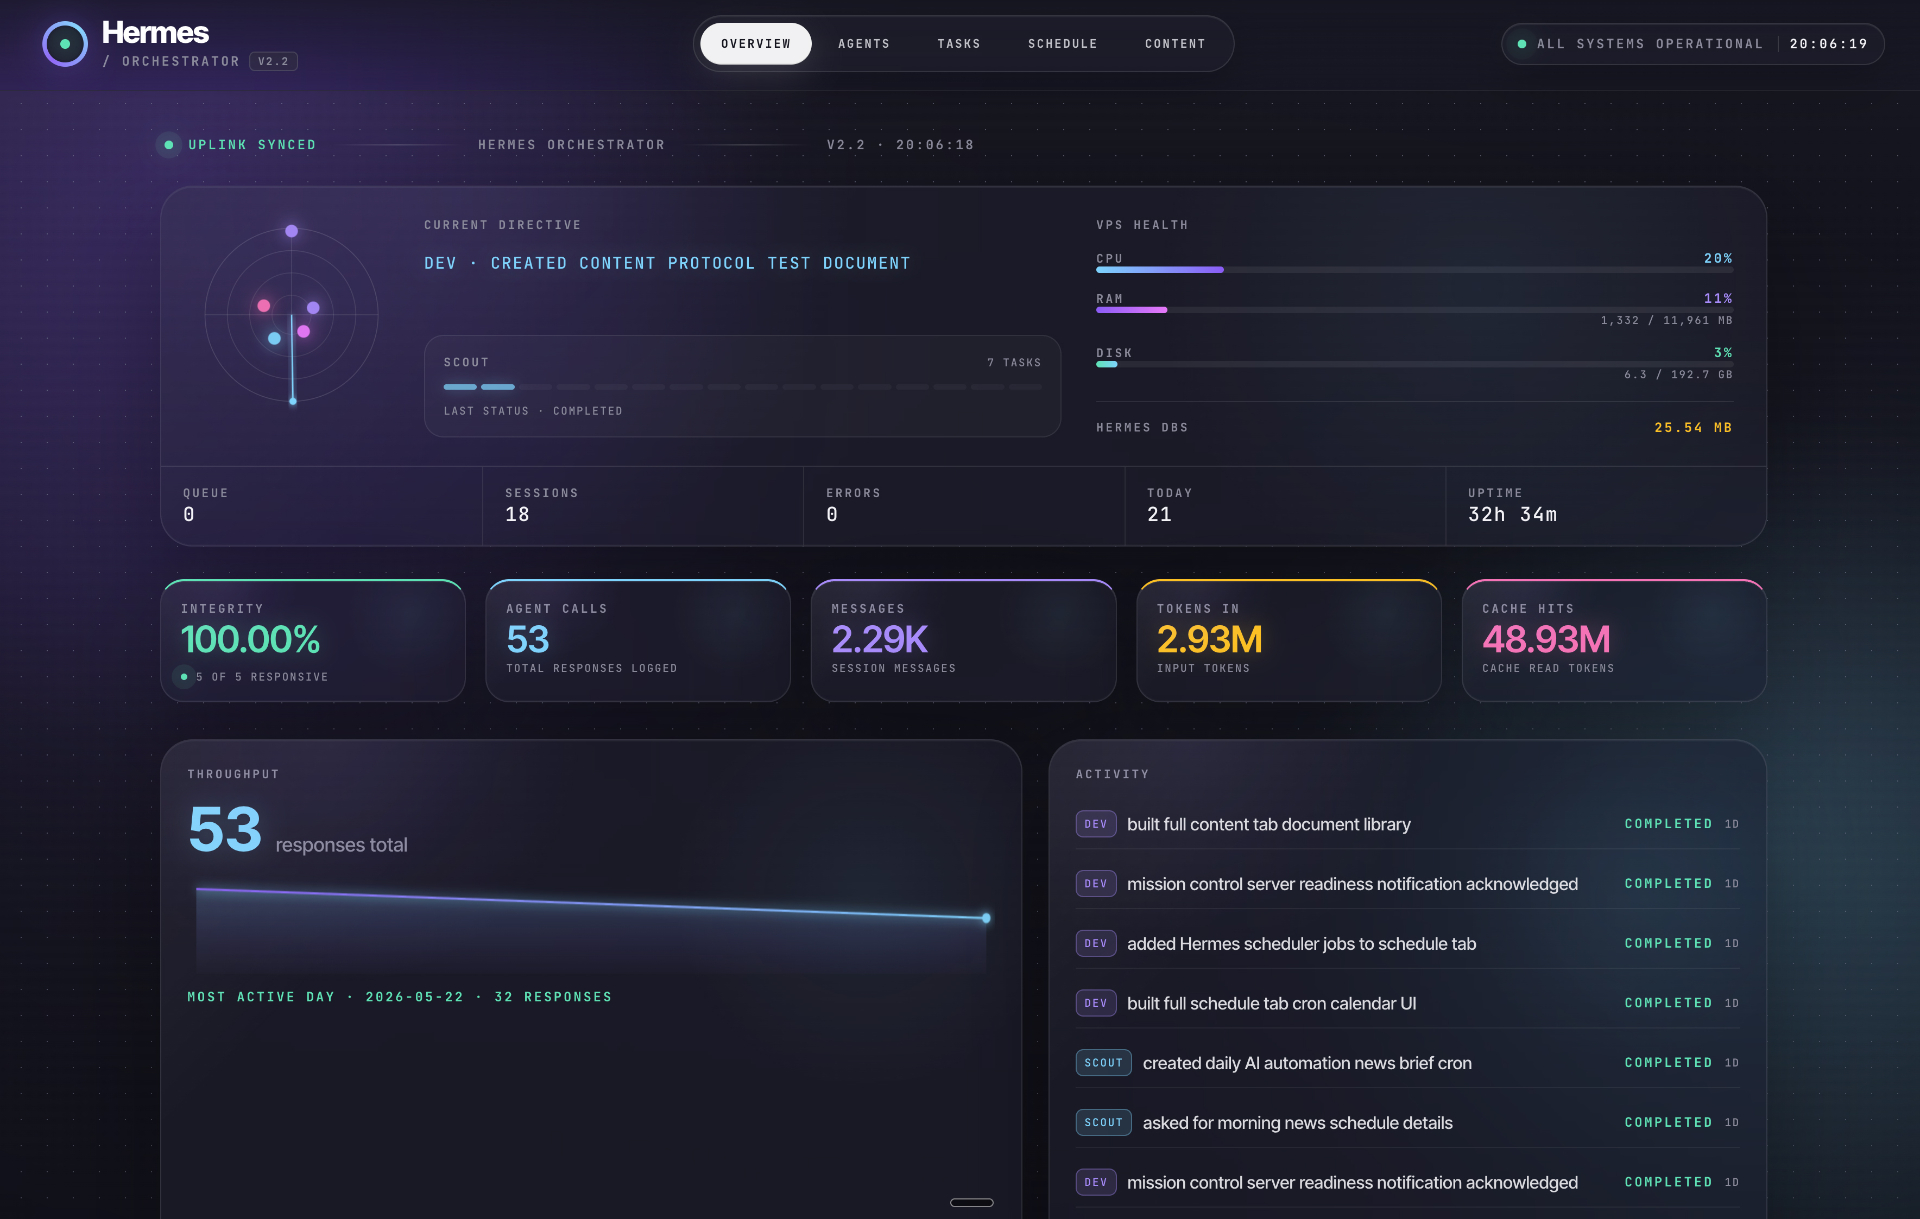
Overview — Live Ops Console
Current directive, VPS health, throughput sparkline, and activity feed in one fast-read cockpit.
A polished mission-control interface for monitoring your Hermes agents, daily automations, kanban tasks, cron schedules, and generated content from one calm command surface.
Instead of a long raw tutorial page, this version puts the finished Hermes dashboard experience front and center with clearer visual hierarchy and better spacing.
Current directive, VPS health, throughput sparkline, and activity feed in one fast-read cockpit.
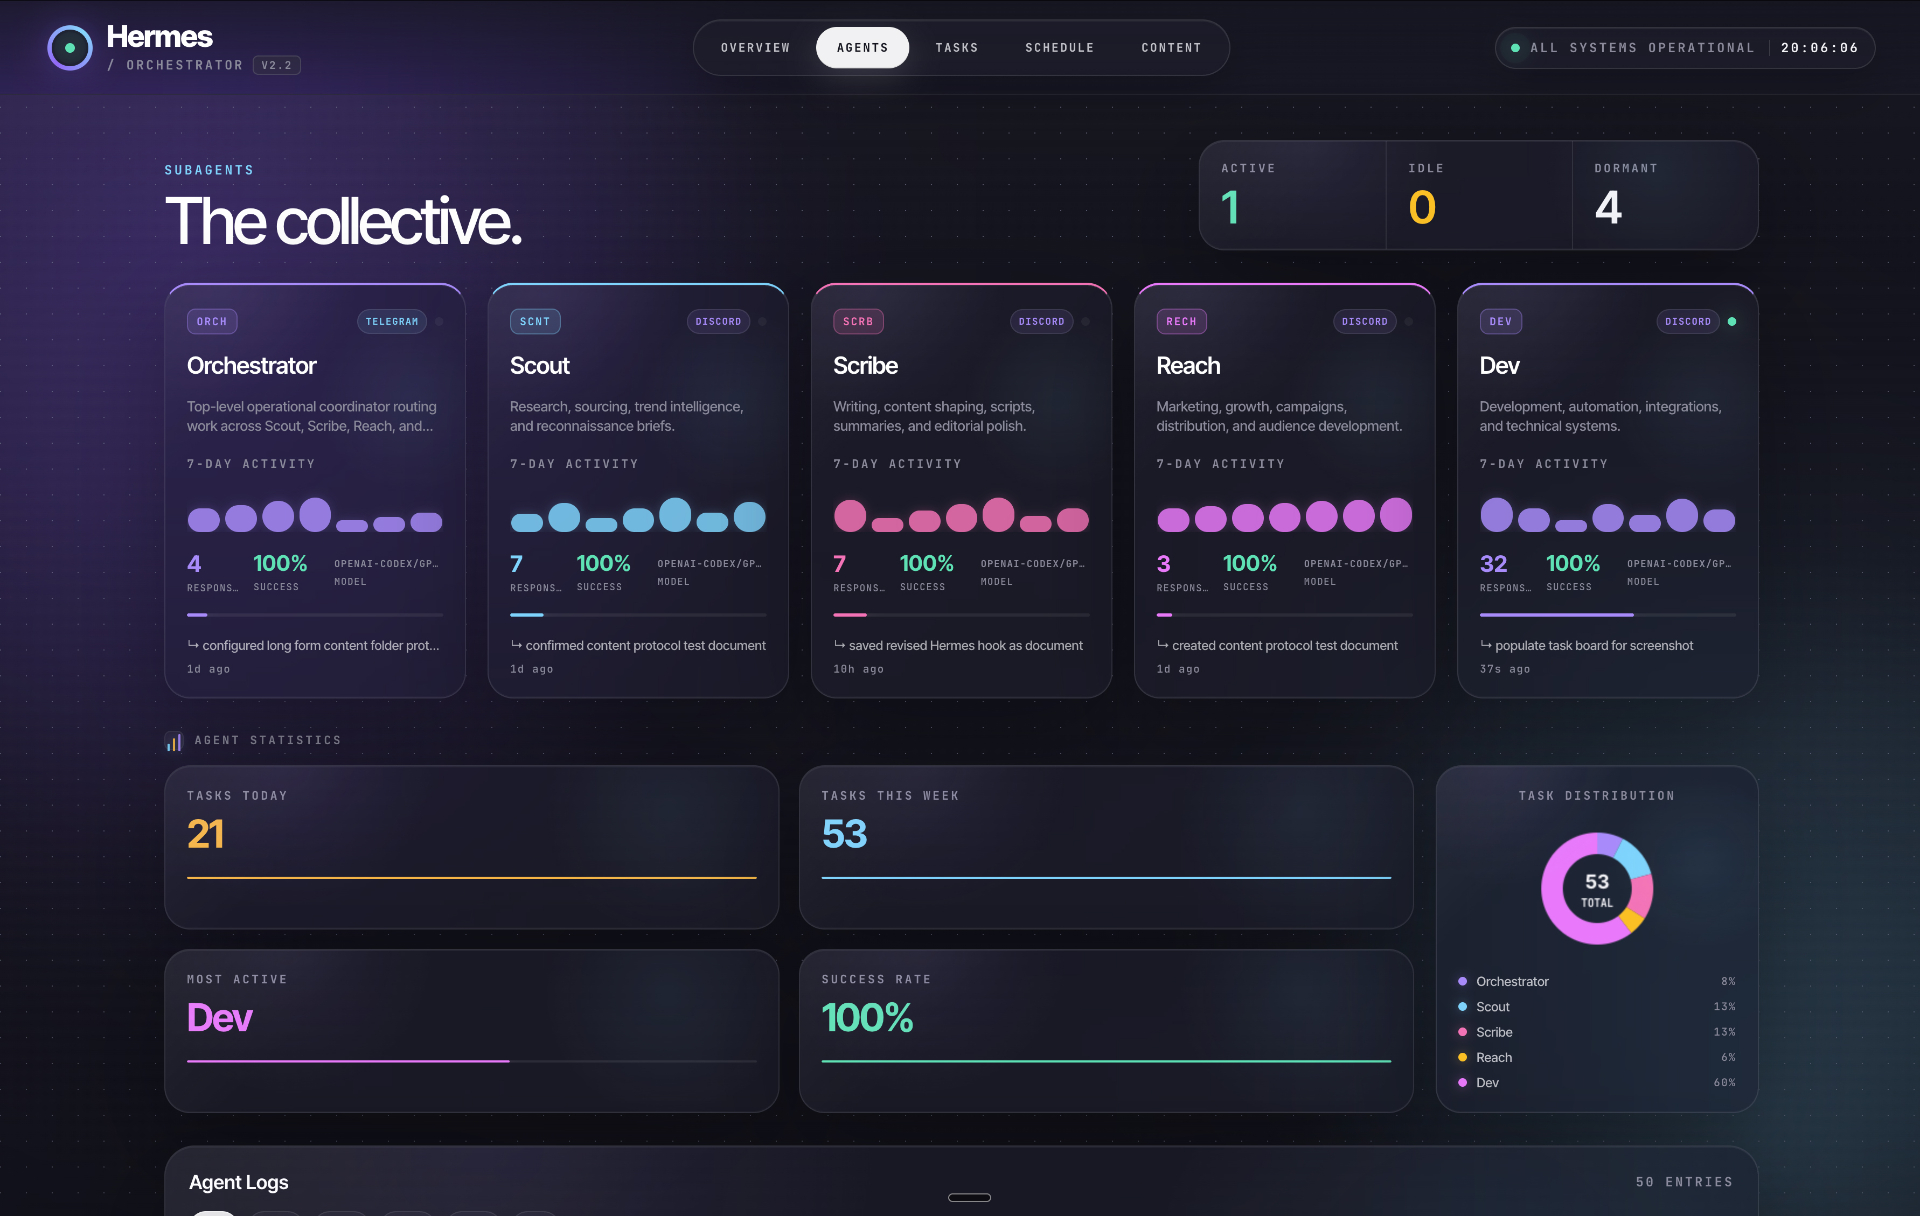
Per-agent activity, response counts, models, and task distribution.
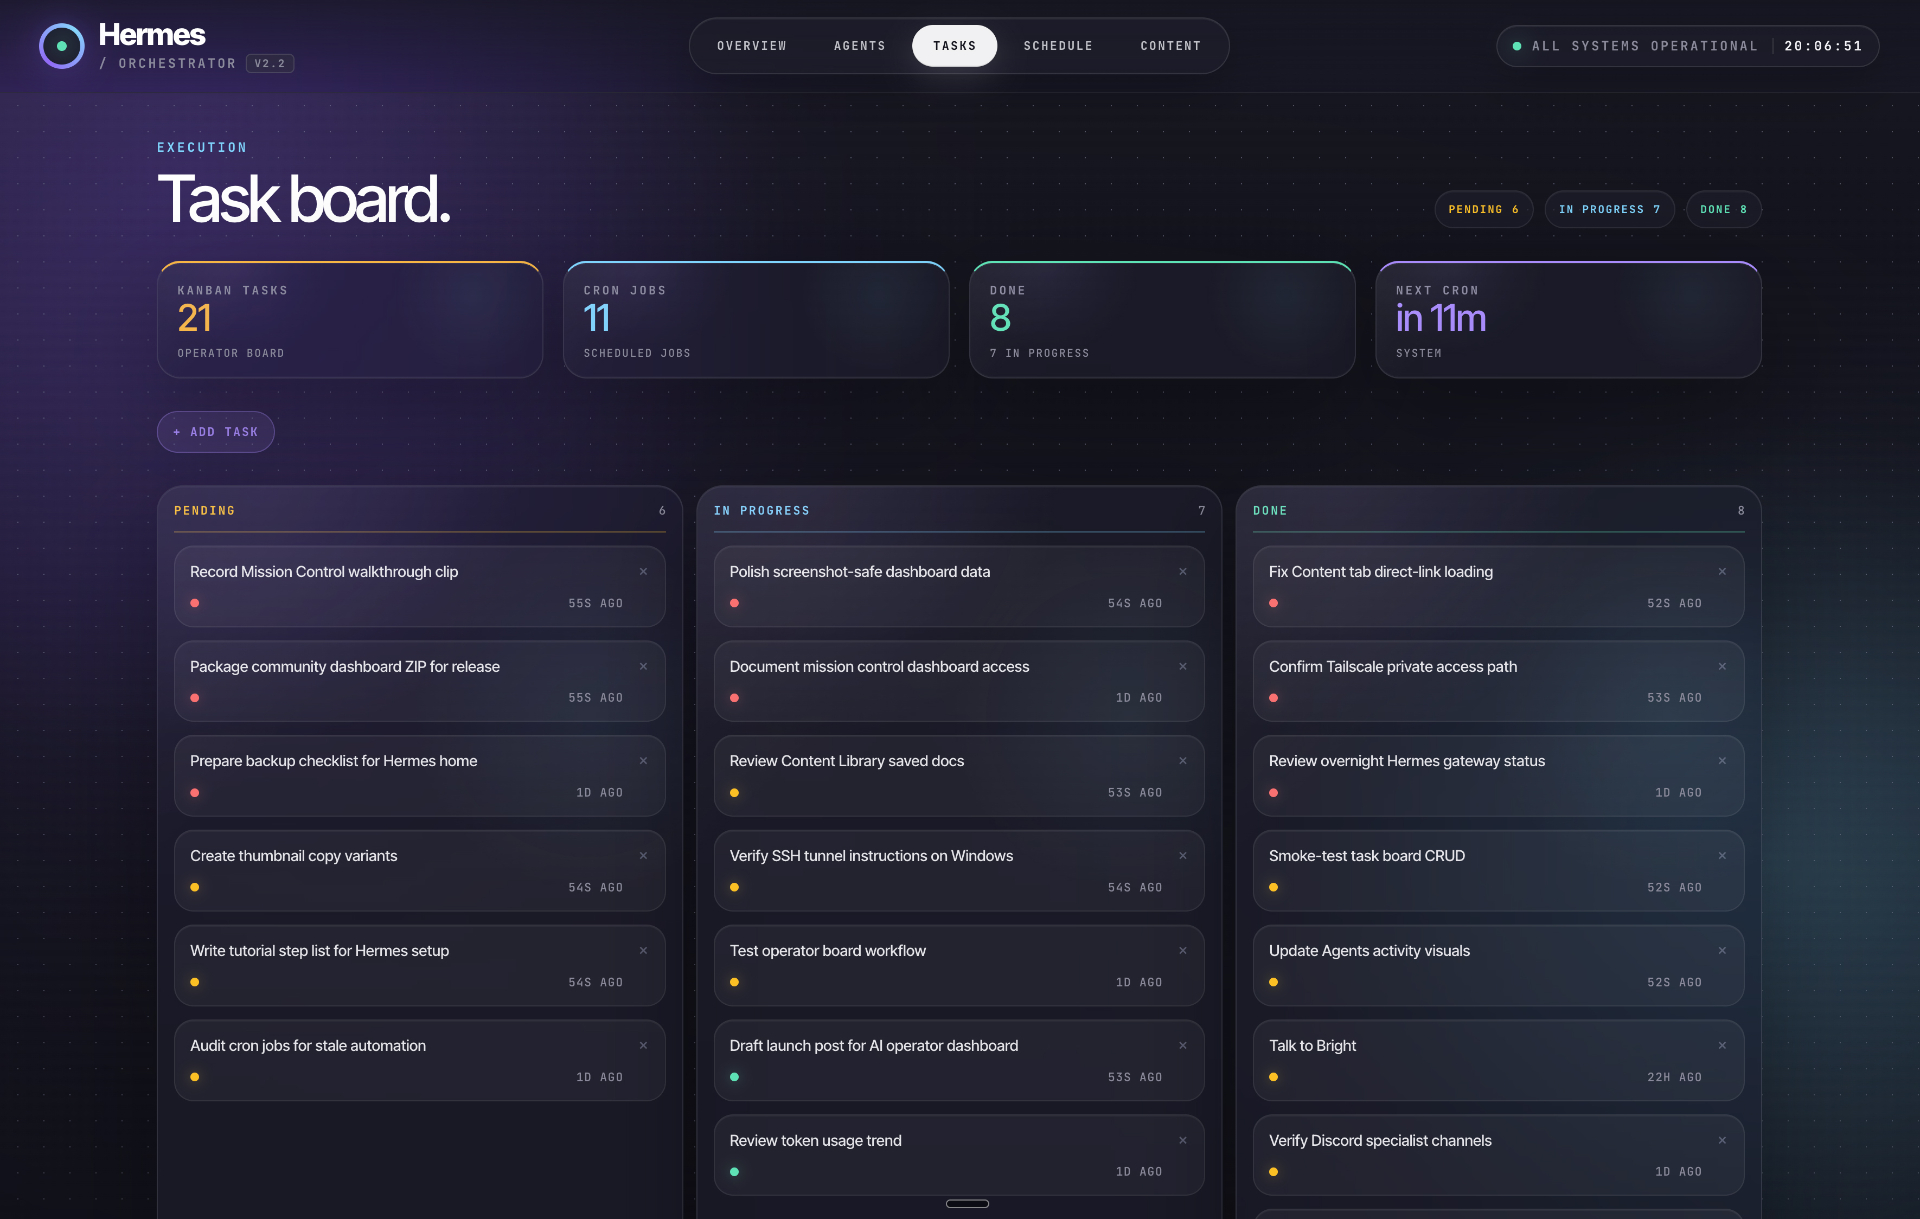
Pending, in-progress, done, and cron counters shaped for execution.
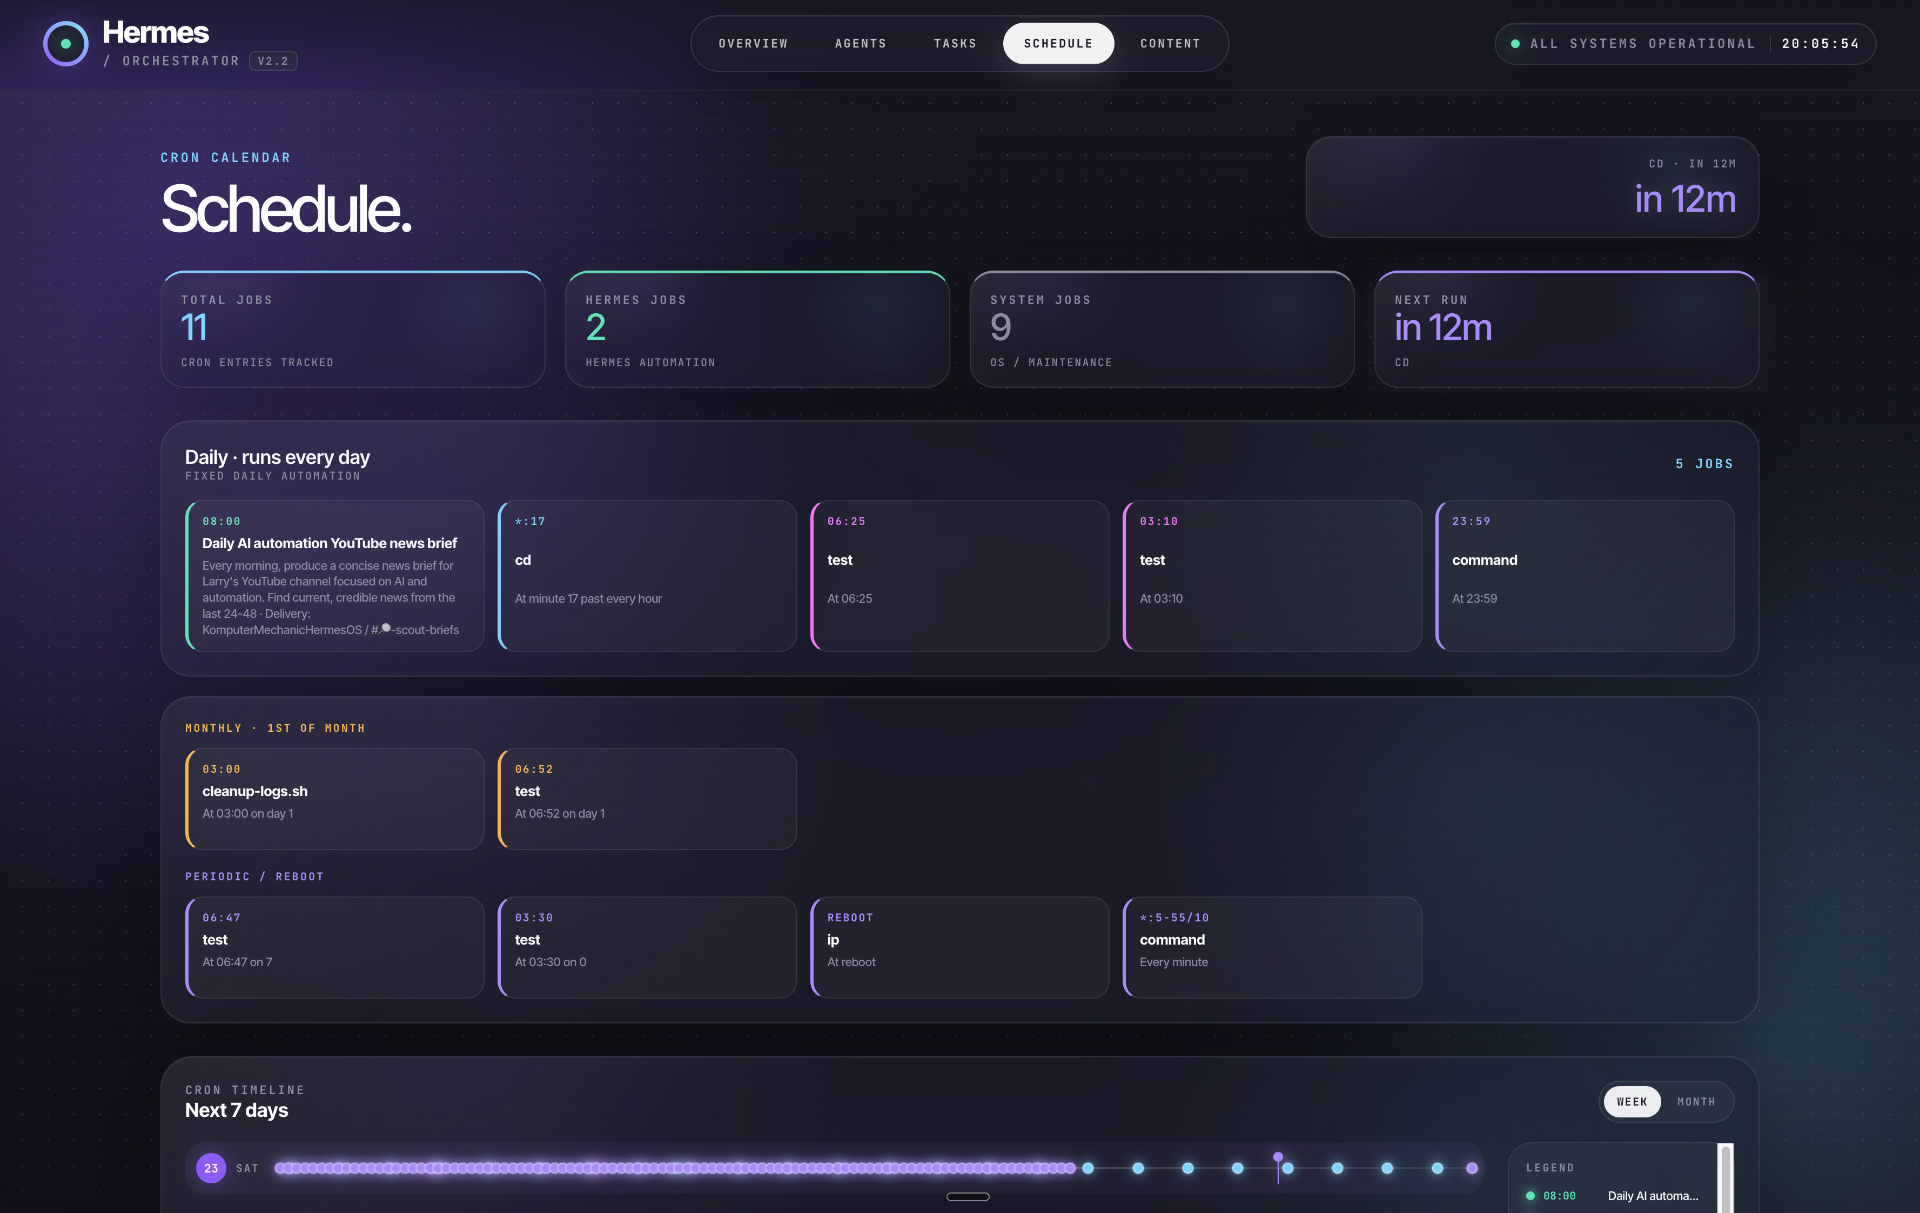
Cron calendar grouped by cadence with a next-seven-days timeline.
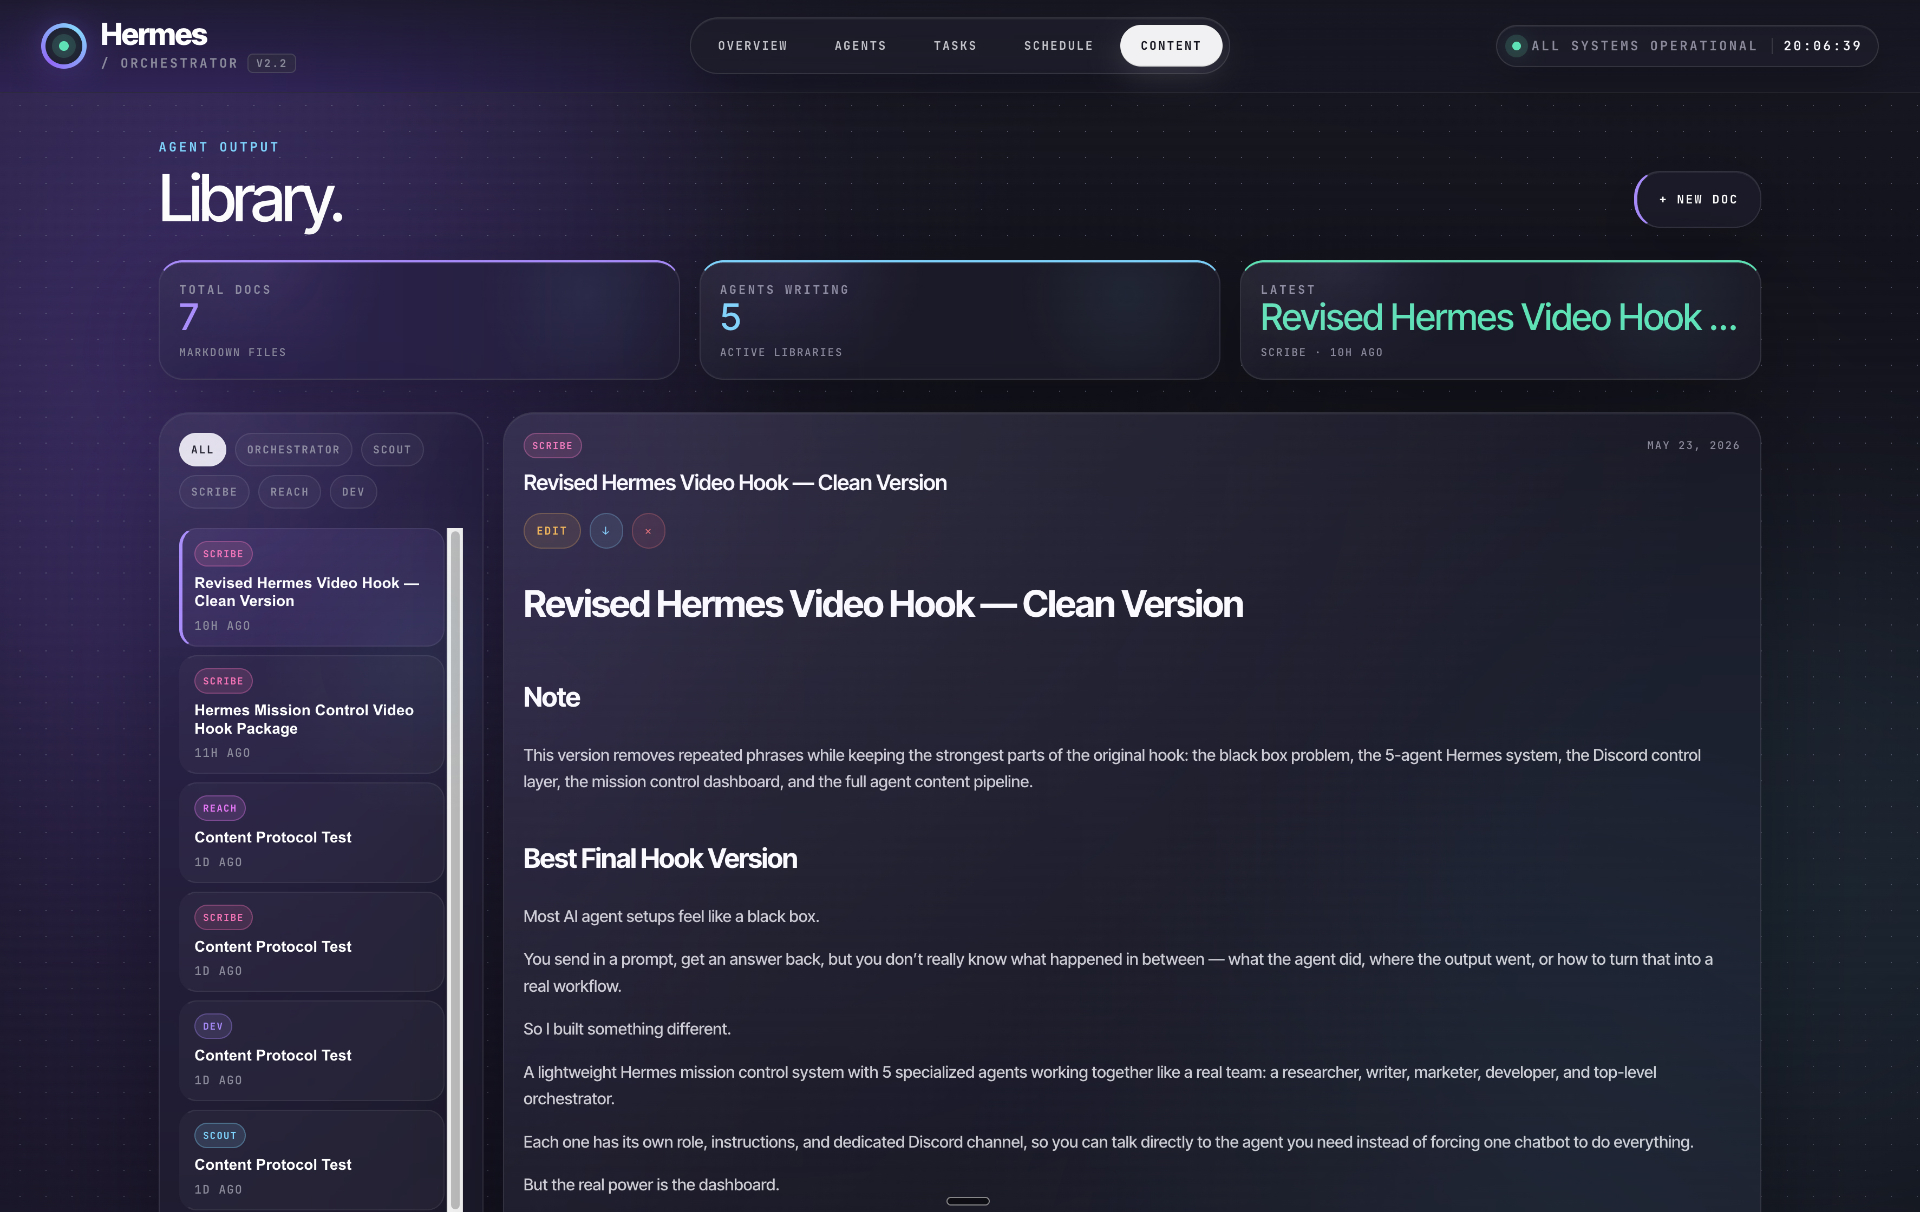
Agent-generated markdown documents with filtering and full preview.
The dashboard should help you decide what to do next: what is healthy, what is blocked, what is shipping, and what the agents produced.
See which agents are active, what they handled, and where throughput is changing.
Track task state across pending, in progress, done, and scheduled automation work.
Turn cron jobs into plain-English visibility so important automations do not disappear.
Review generated assets and documents without digging through folders or chat history.
This page is a cleaner front door for the Hermes dashboard concept. The original step-by-step tutorial remains linked for the full implementation walkthrough.
Give Hermes a clear command role, communication channel, and operating rules.
Separate agent identities, workspaces, and responsibilities so each lane is understandable.
Connect Telegram, Discord, slash commands, activity logging, and task pipelines.
Feed the dashboard with tasks, schedules, content files, agent events, and system health.
Use the dashboard as the daily execution surface for deciding, delegating, and verifying.
The next upgrade is making this real for your own Hermes instance: authenticated access, live kanban data, cron status, server health, and agent activity from your actual environment.